Unified, reliable and actionable data for your teams/clients
The seamless process of combining and unifying diverse data sources into a unified view.
The comprehensive approach to acquiring, storing, processing, and protecting data throughout its lifecycle.
The systematic exploration and interpretation of datasets to extract valuable insights and inform decision-making.
The graphical representation of data to communicate complex information clearly.
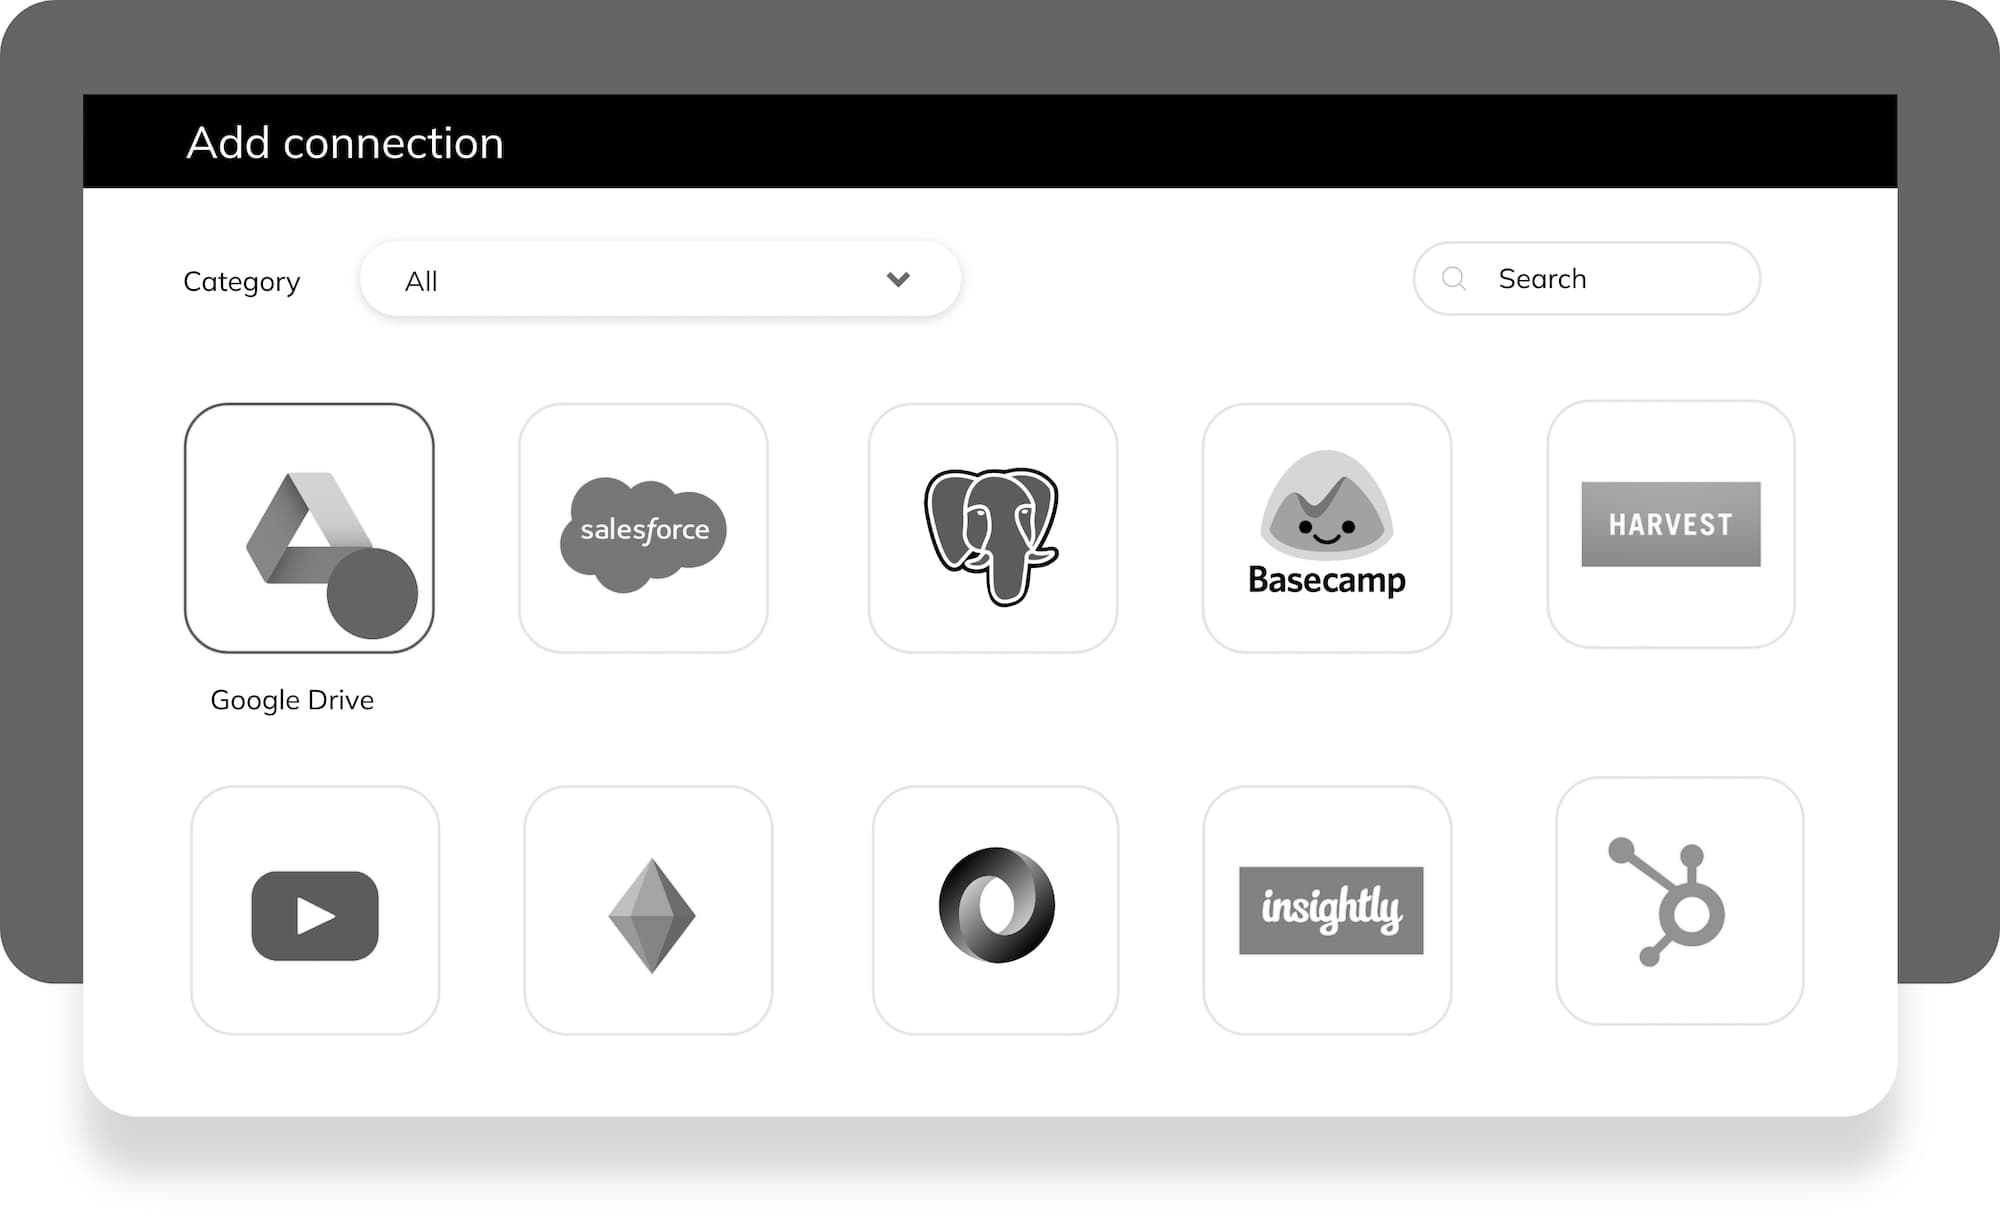
We offer many ways to connect to your data. Wherever your data is, in the cloud, on-premise, in a database or in a SaaS application, we can connect to it.
Use our Smart Views™ to connect to well known applications and pre-format your data, making it ready for analytics; or use our powerful Web Services connector to connect to hundreds of APIs.
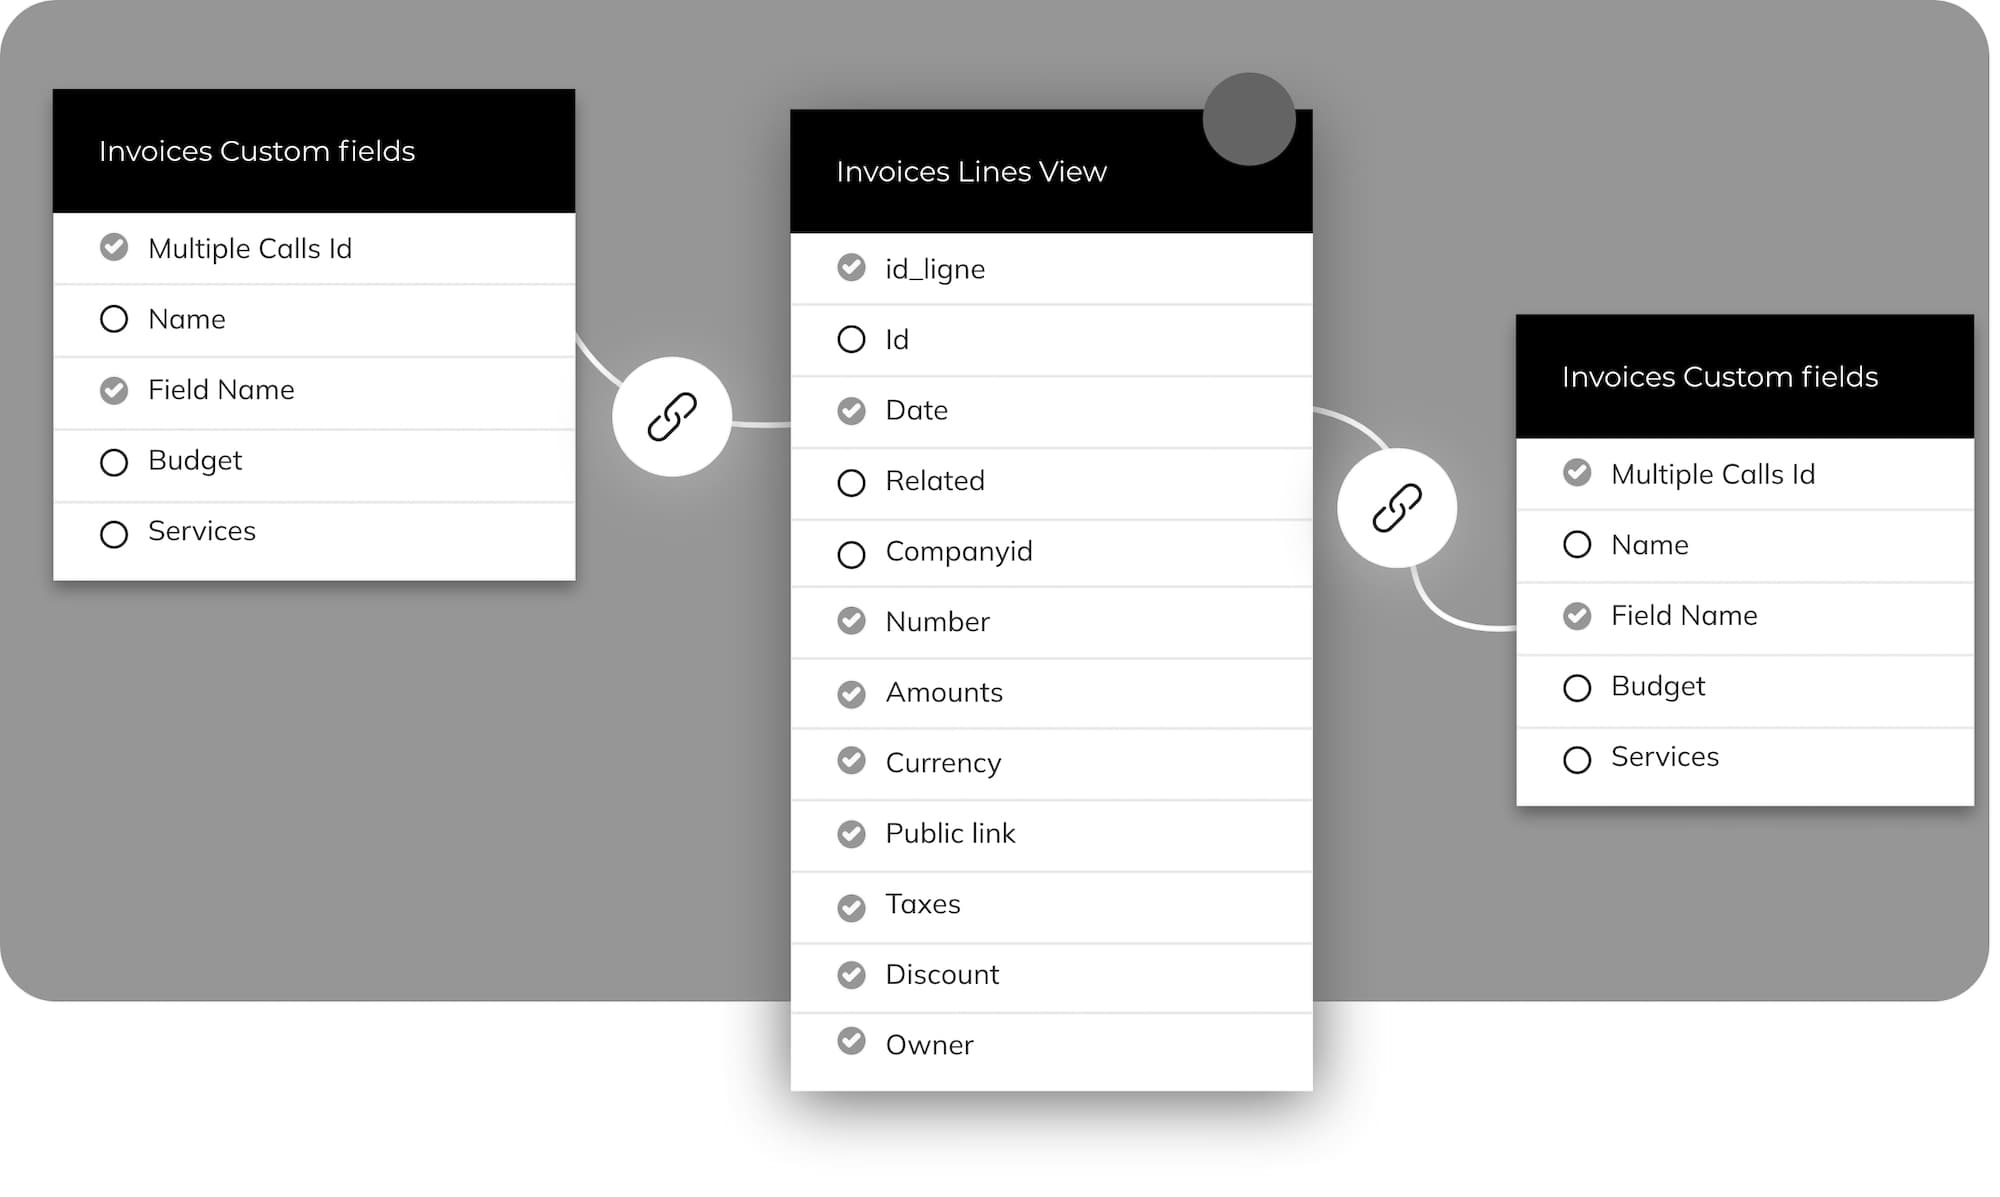
Getting the data is easy but turning it into something useful is more challenging. This is where our Data Flow module comes in to make this task easy and quick.
Use it to shape, merge, fusion and calculate your data anyway you want by connecting Data Flow nodes to each other and build an end to end flow of data ready to be executed on demand or on a schedule.
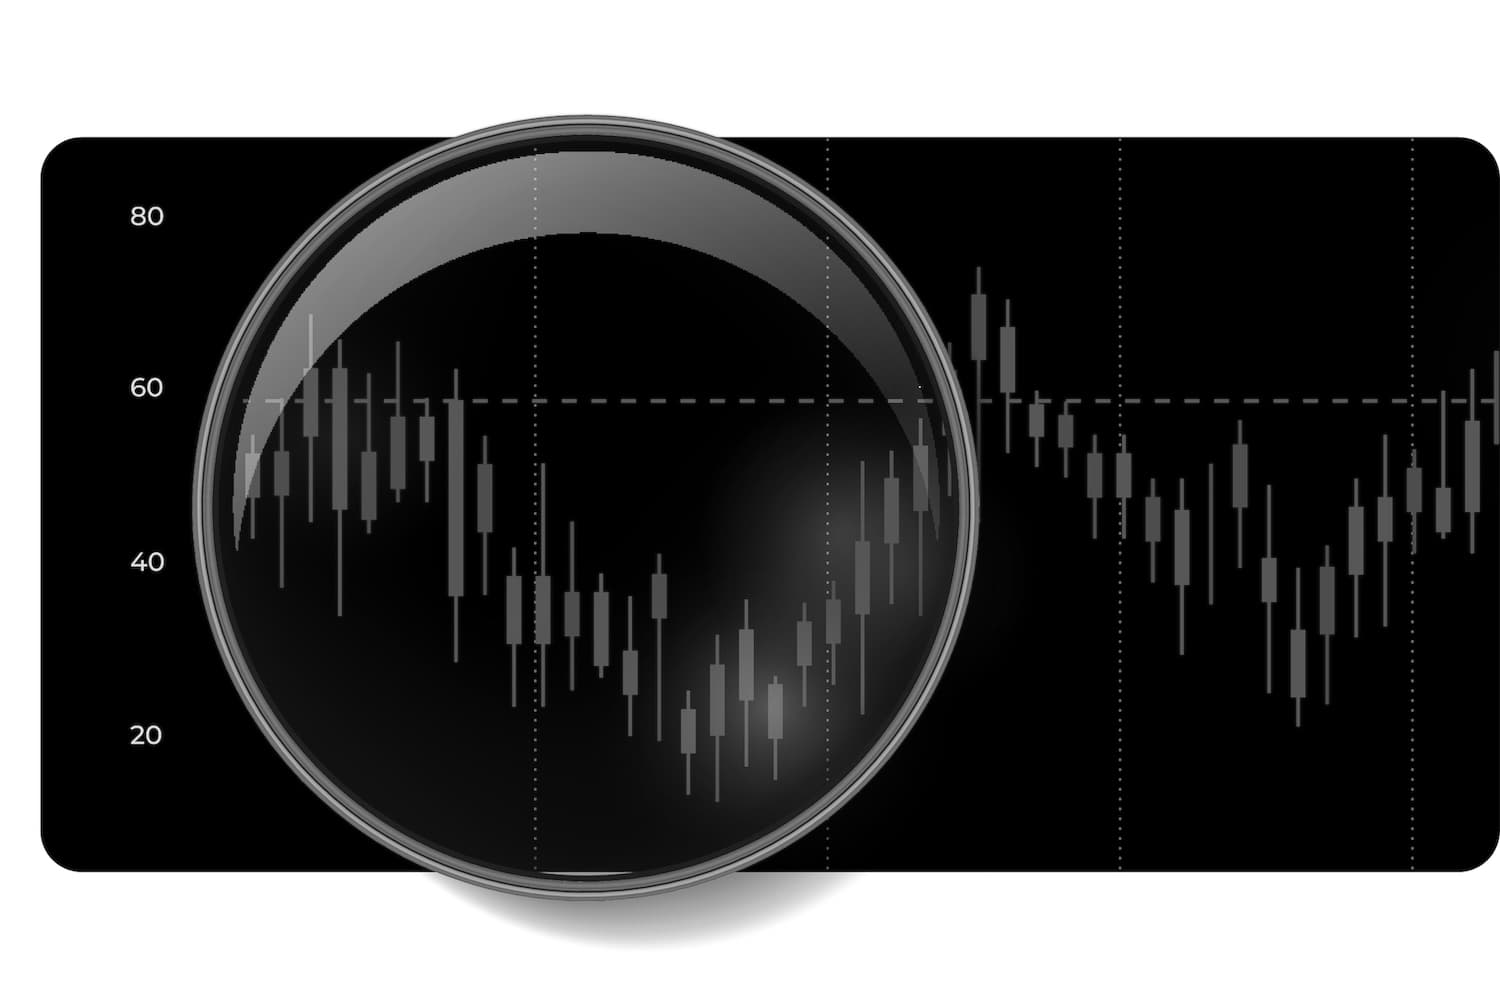
Use our Quick Insights™ to dig into your data and perform correlations, groupings and trends. Analyze the data and start building your indicators and recurring metrics by iterating through the tables and their relationships.
With our data tools you can create snapshots of the data to compare them over time independent of the data sources.
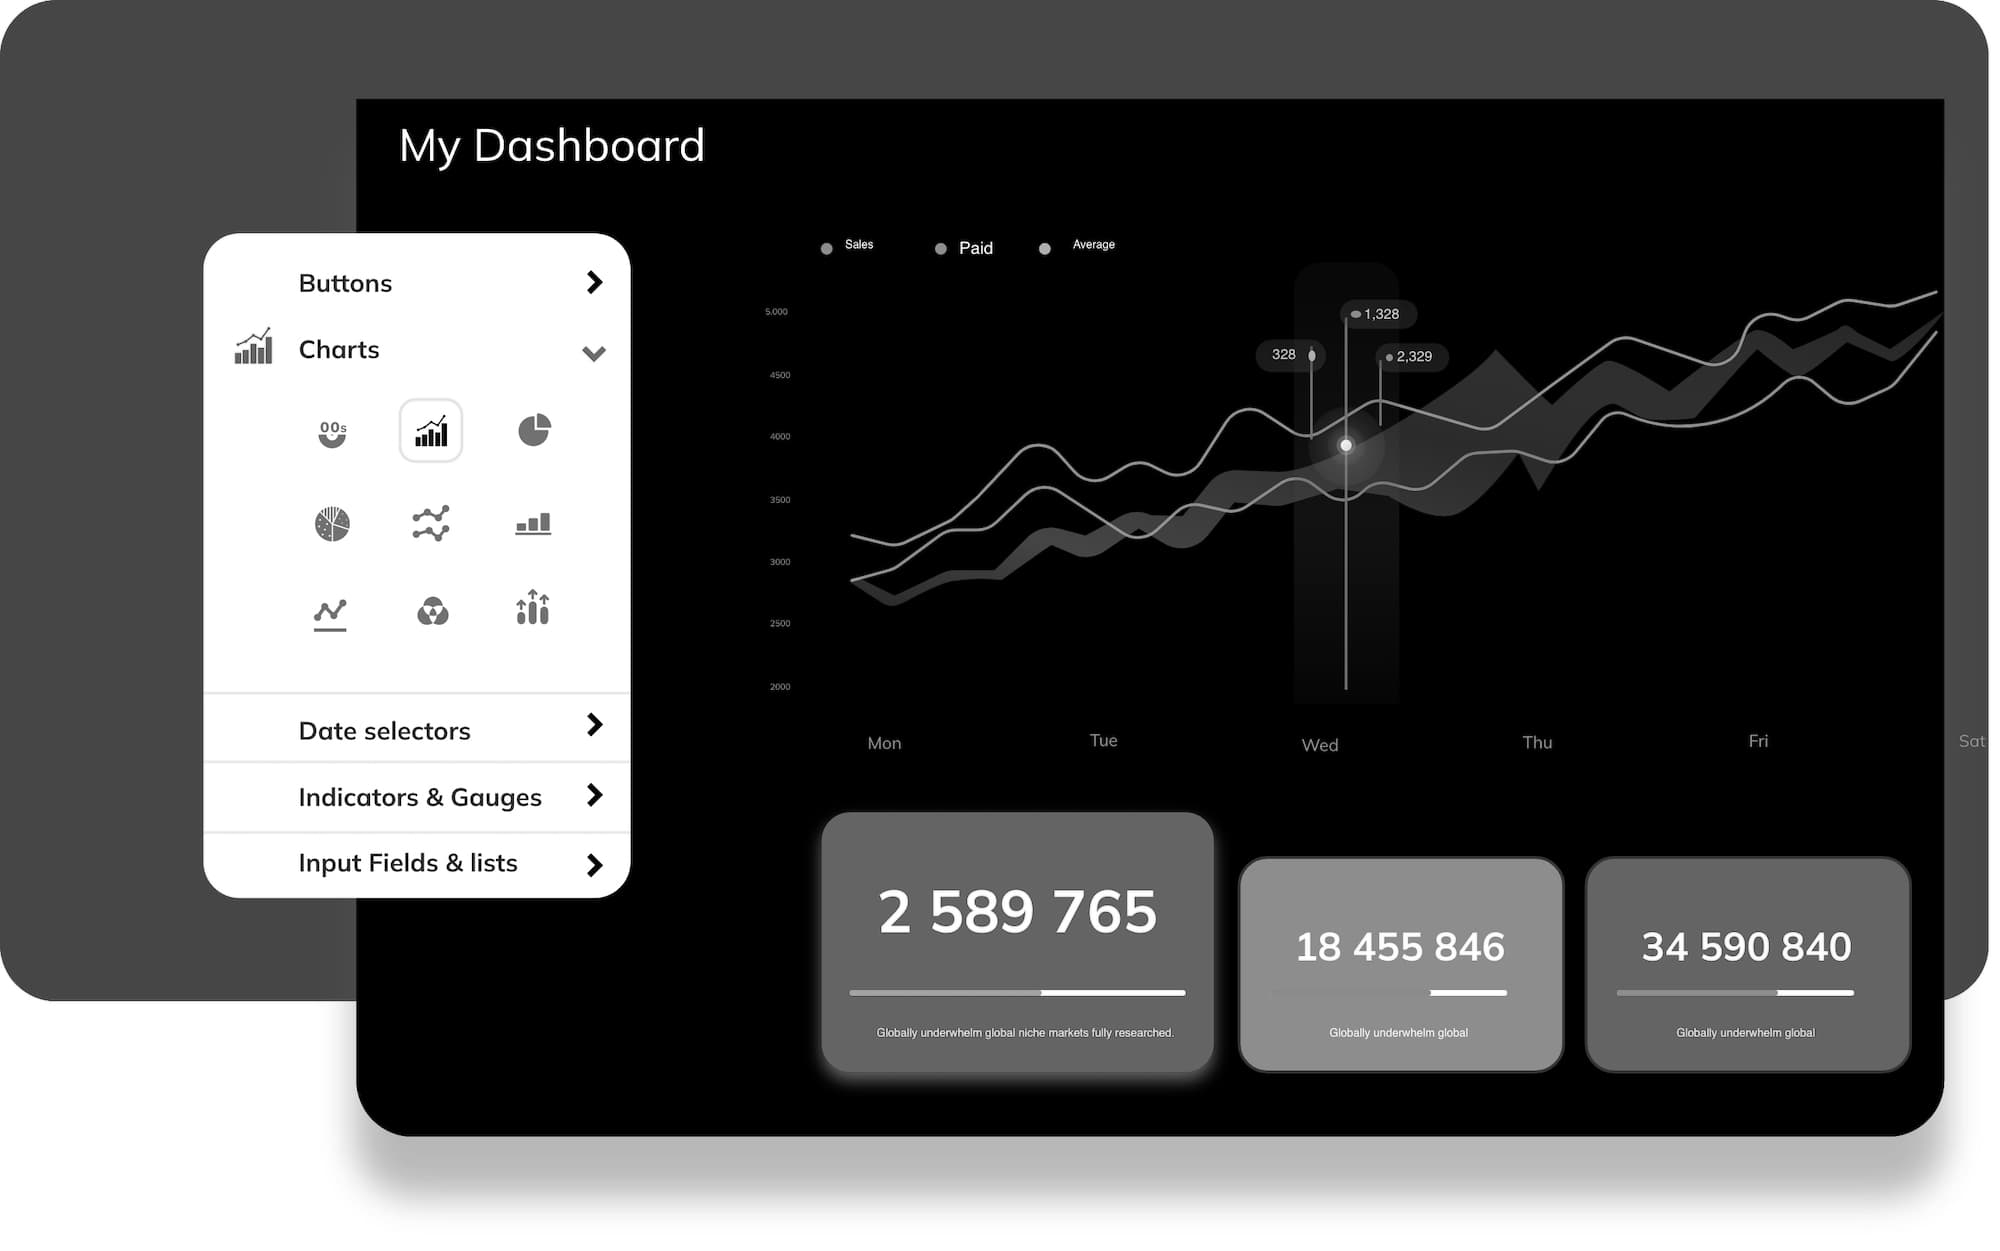
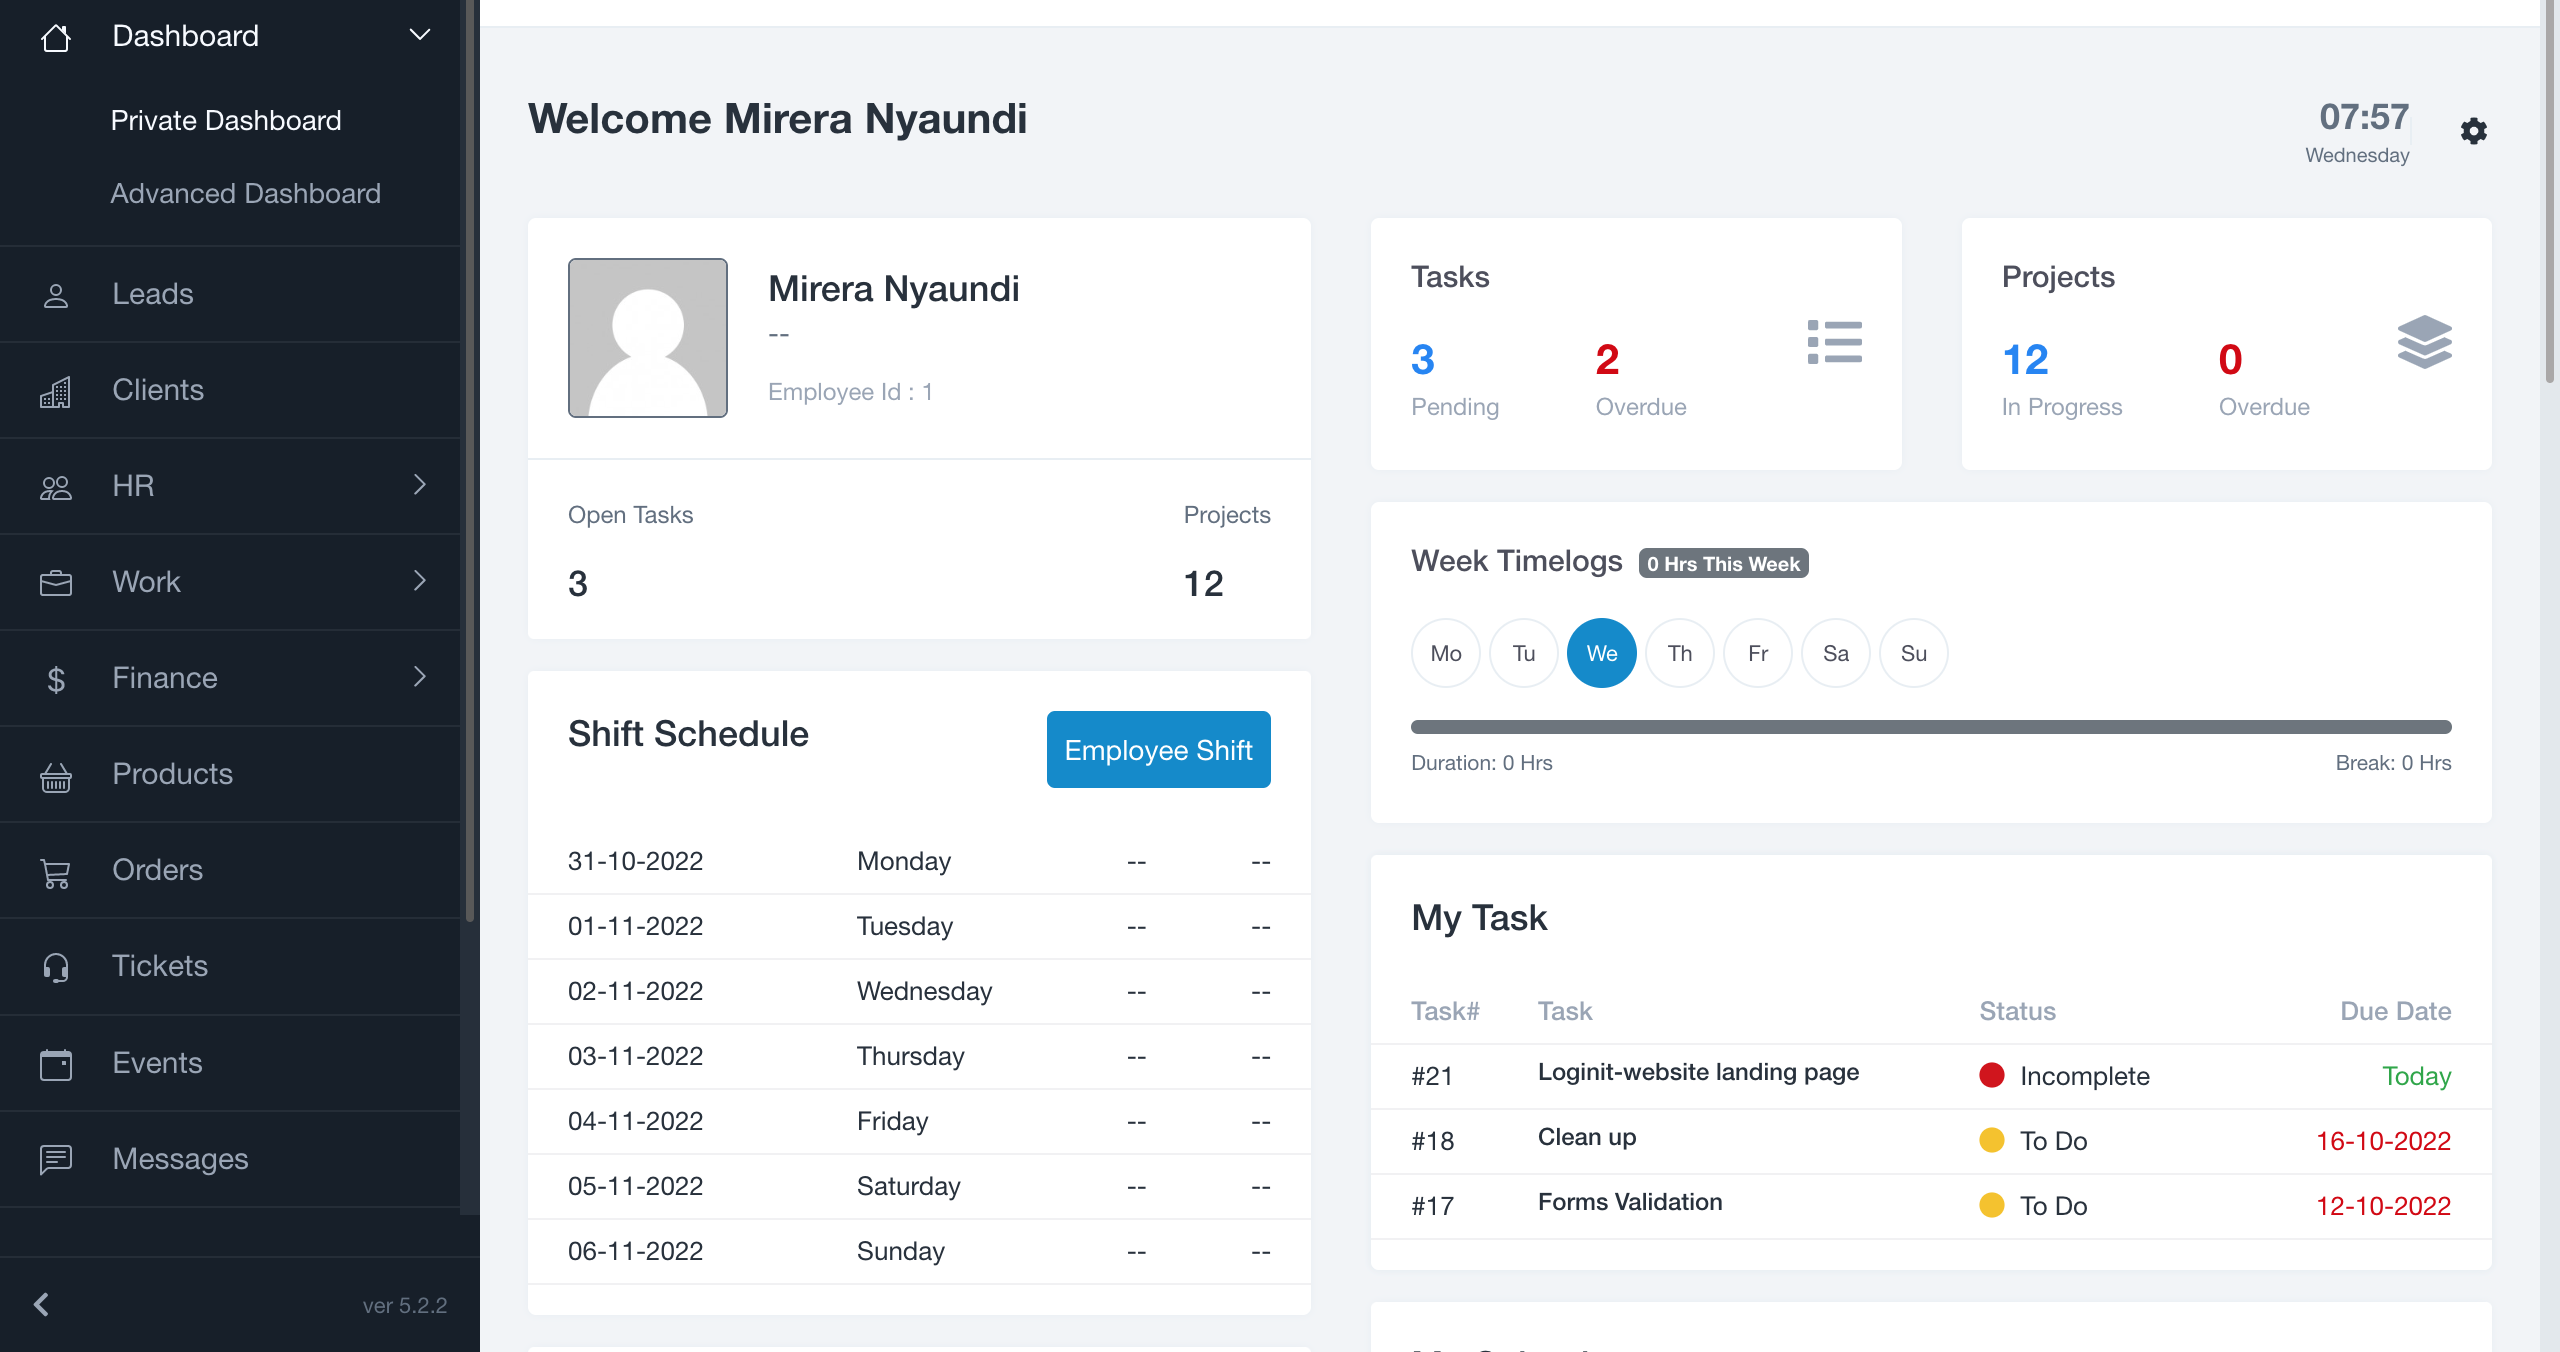
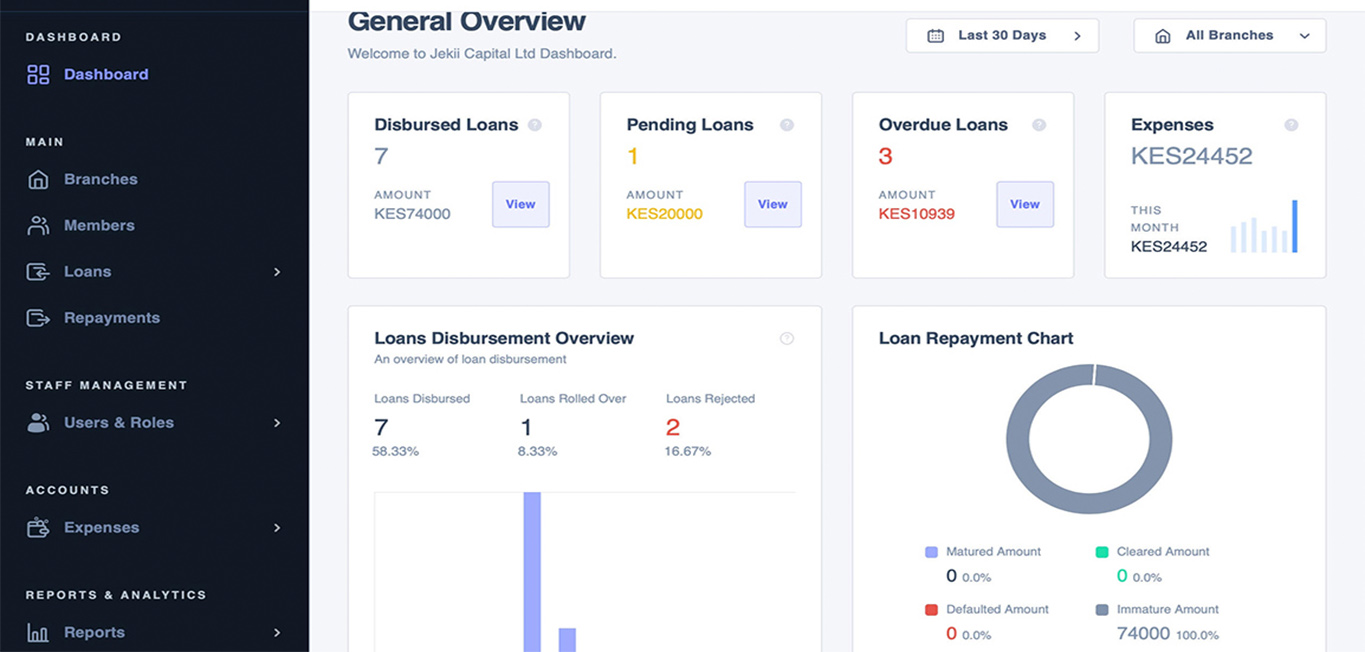
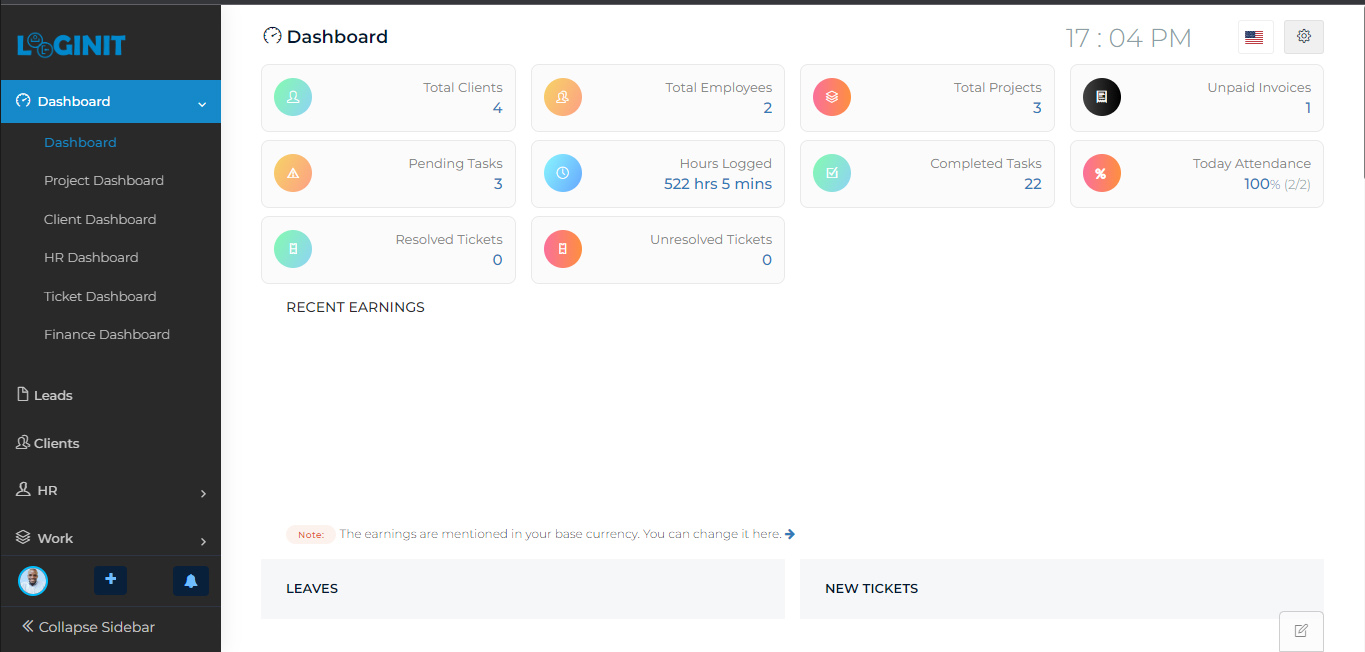
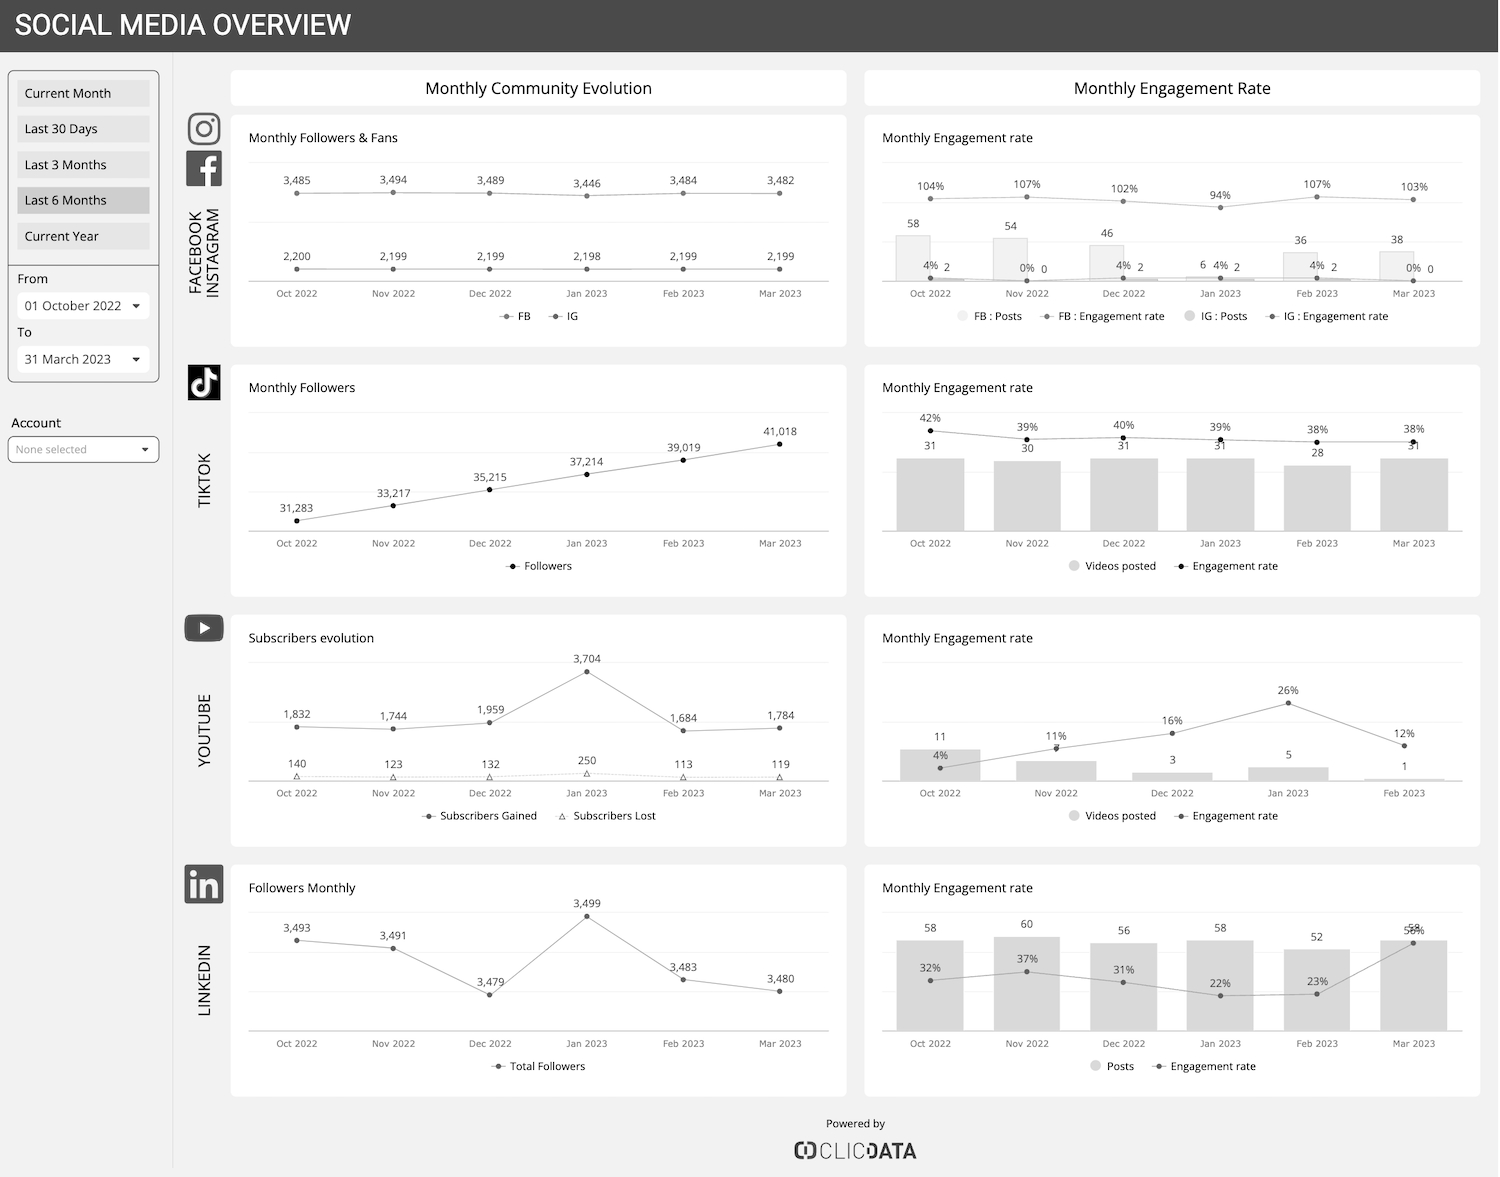
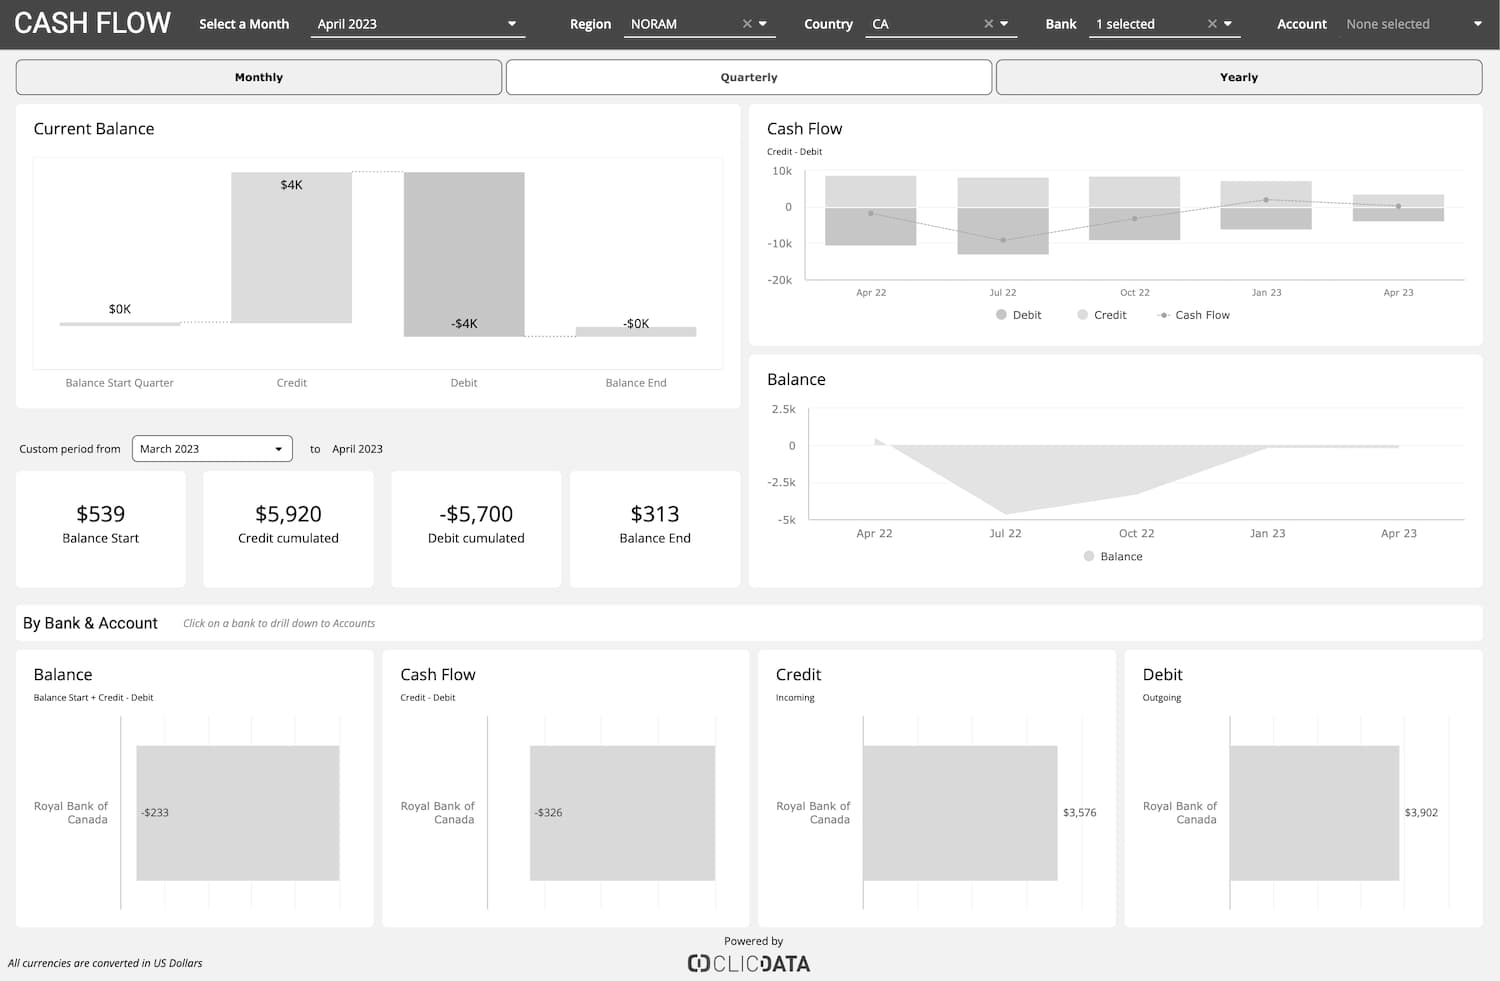
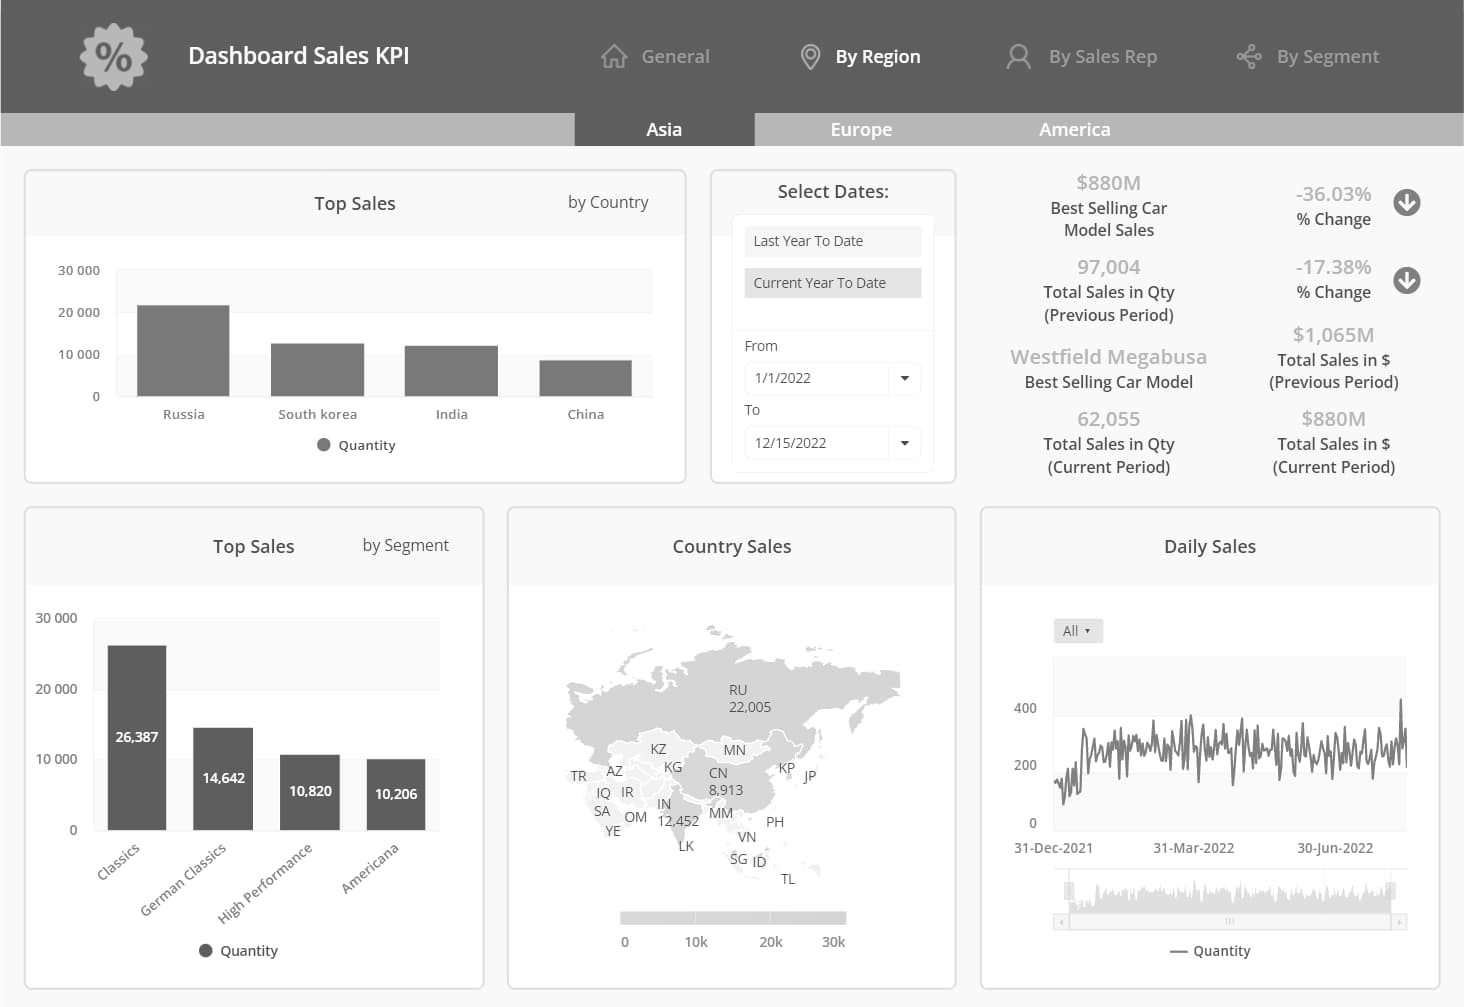
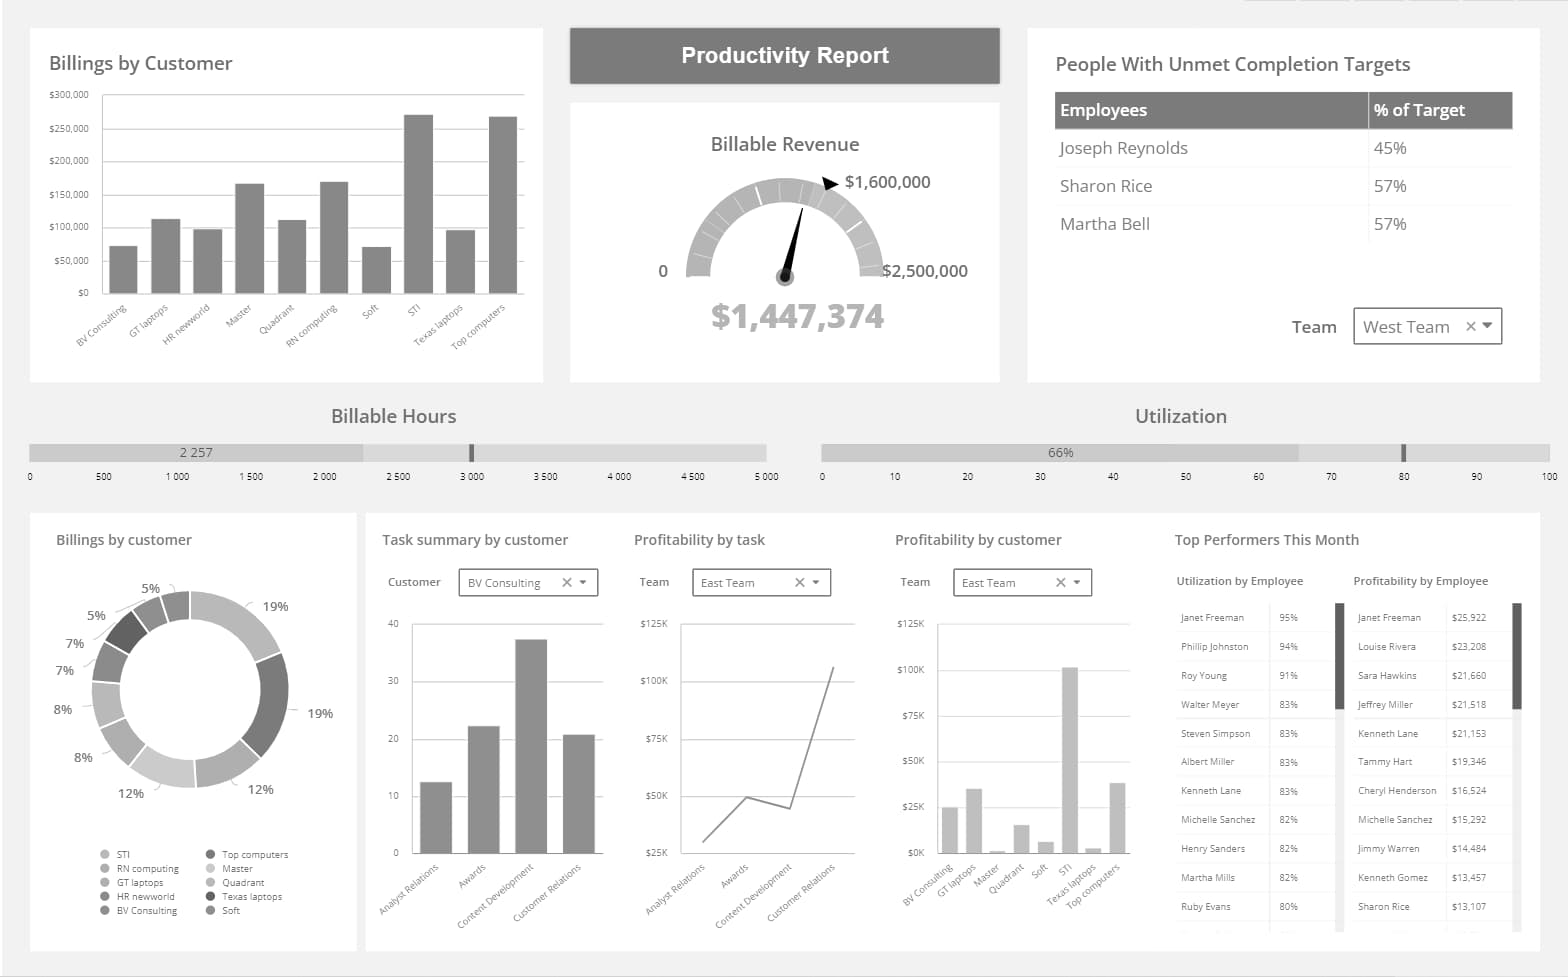
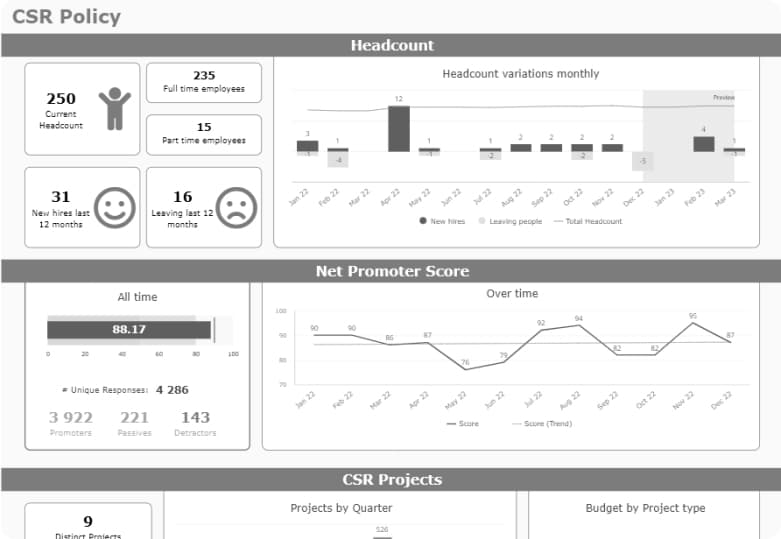
Our Dashboard module gives you the ability to focus on Key Performance Metrics with over 70 visualization and input widgets giving you full control of how your dashboards look, react and interact.
Our Report module gives you pixel perfect, PDF output of multi-page documents, giving you the best of both worlds from tabular data to aggregated data.
Automate everything in Loginit with a powerful scheduler and alert system that can refresh data, trigger publications of dashboards and reports to selected users via email every morning before your first cup of coffee.
Use our mobile phone application to access dashboards and reports on the move or embed our dashboards directly into your company portal, website or application.
For companies in any sector: rapidly make your organization data-driven and boost your various teams’ performance with our Data Analytics and Business Intelligence platform.
For Services Providers and Consulting firms: turbo-charge your offering with our Data Analytics and Business Intelligence platform, adapted to your brand and/or your clients’ brands.
For software companies in any domain: embed our best-in-class data engine and visualization into your solutions. Focus on your core expertise and leave the rest to Loginit.